Health Monitoring
The consumer exposes endpoints for health checks, statistics, and monitoring via Prometheus.
Available Endpoints
| URI | Description |
|---|---|
/actuator/info | Shows/returns the version of the Consumer and License information |
/actuator/health | Shows/returns the health of the consumer |
/actuator/metrics/<metric_name> | Shows/returns the value of the specified metric |
/actuator/metrics | Lists all available metrics |
/actuator | Shows all available endpoints |
/actuator/prometheus | Exposes Prometheus-formatted metrics |
Accessing Health Endpoints
The endpoints are accessible based on the hosted platform and configured port.
Docker Example
When hosting on Docker and exposing port 8080:
curl http://localhost:8080/actuator/health
Kubernetes Example
kubectl port-forward pod/solifi-consumer-xxx 8080:8080
curl http://localhost:8080/actuator/health
Health Check Response
A healthy consumer returns:
{
  "status": "UP",
  "components": {
    "db": {
      "status": "UP"
    },
    "diskSpace": {
      "status": "UP"
    },
    "ping": {
      "status": "UP"
    }
  }
}
Prometheus Integration
The consumer exposes a /actuator/prometheus endpoint for integration with Prometheus-based monitoring systems.
Sample Prometheus Scrape Config
scrape_configs:
  - job_name: 'solifi-consumer'
    metrics_path: '/actuator/prometheus'
    static_configs:
      - targets: ['solifi-consumer:8080']
Key Metrics to Monitor
| Metric | Description |
|---|---|
kafka_consumer_records_consumed_total | Total records consumed |
kafka_consumer_records_lag | Consumer lag per partition |
jvm_memory_used_bytes | JVM memory usage |
jvm_gc_pause_seconds | Garbage collection pause times |
db_pool_active_connections | Active database connections |
Grafana Dashboards
LimePoint provides sample Grafana dashboards for monitoring:
🔗 LimePoint Solifi Consumer Examples
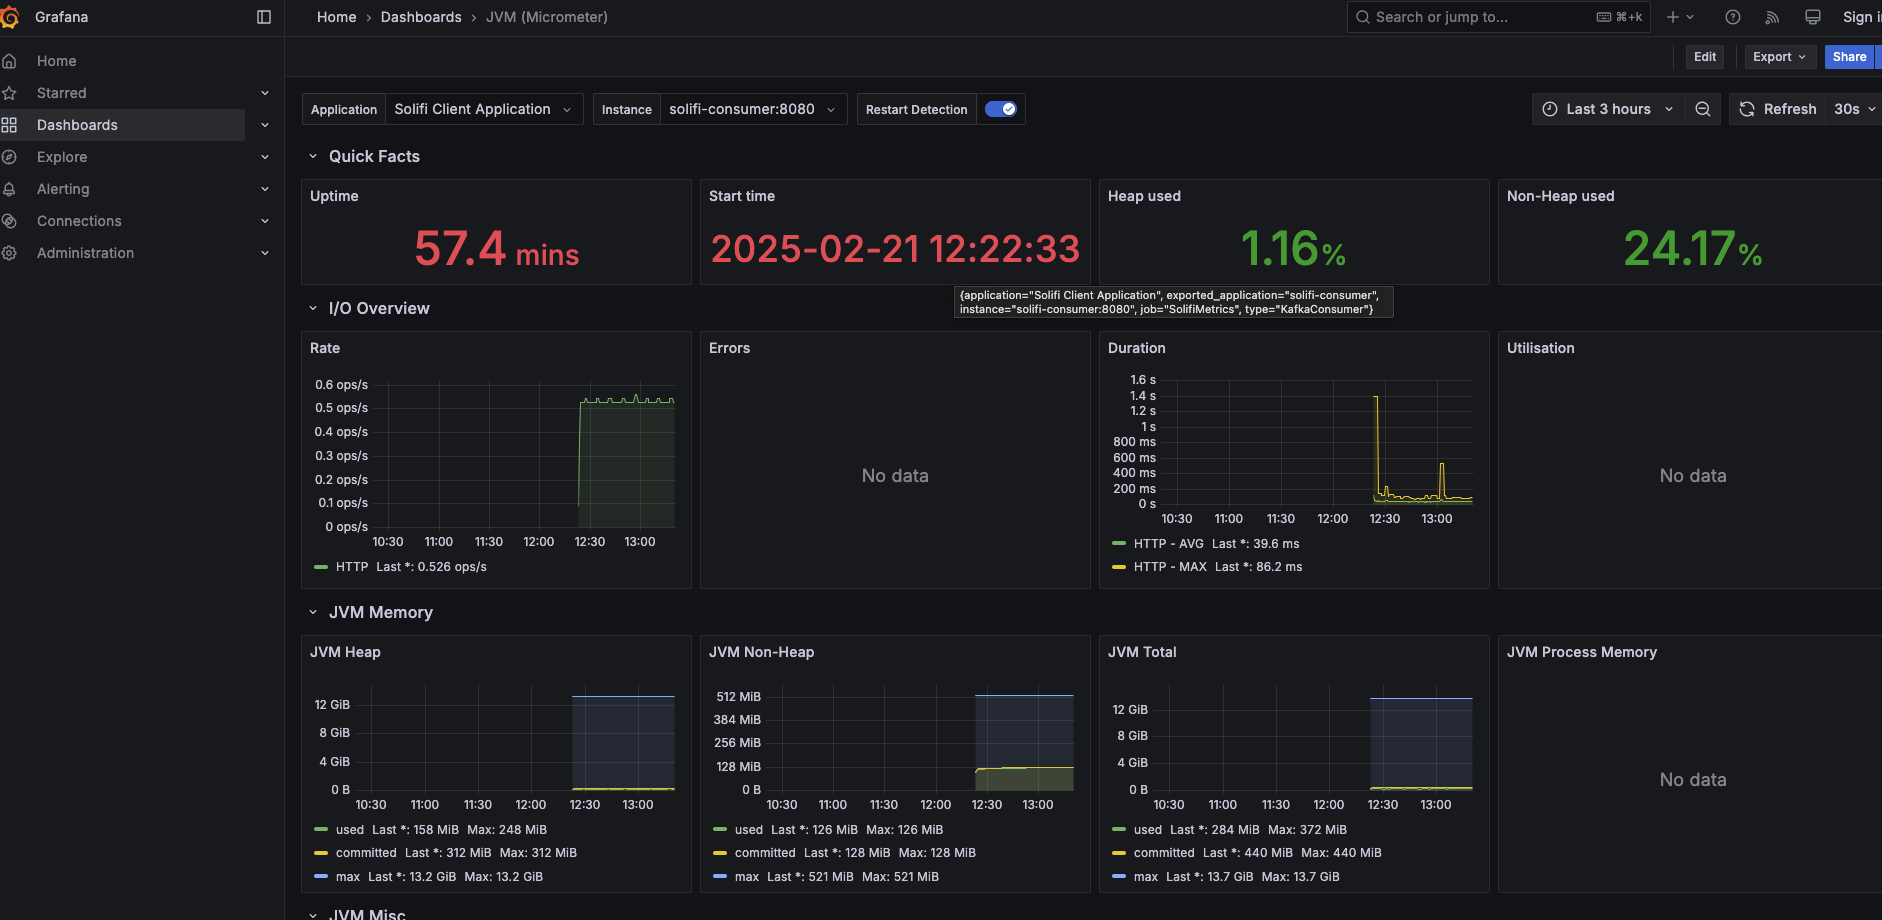
JVM Metrics Dashboard
Monitor JVM performance including:
- Heap memory usage
- Non-heap memory usage
- Garbage collection statistics
- Thread counts
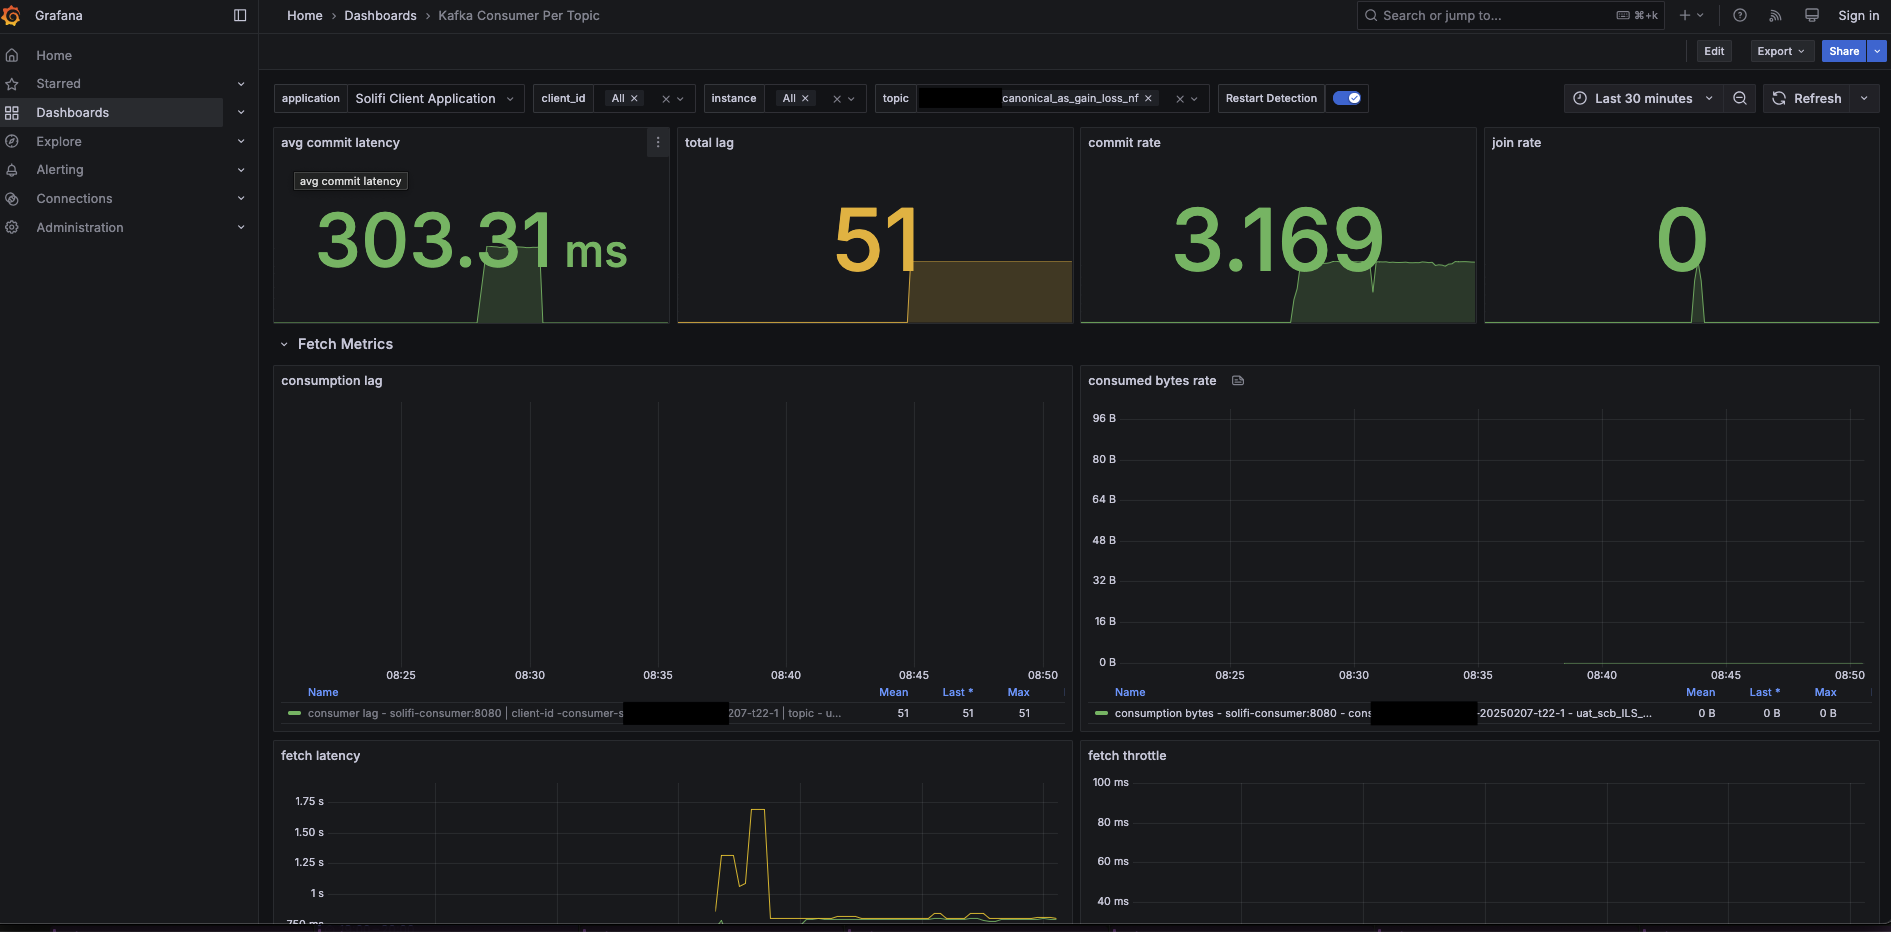
Consumer Metrics Dashboard
Monitor consumer performance including:
- Messages consumed per second
- Consumer lag
- Processing latency
- Error rates
Configuring the Monitoring Port
Set the server port in application.yml:
server:
  port: 8080  # Change as needed
Kubernetes Liveness and Readiness Probes
Configure health probes in your Kubernetes deployment:
spec:
  containers:
    - name: solifi-consumer
      livenessProbe:
        httpGet:
          path: /actuator/health
          port: 8080
        initialDelaySeconds: 60
        periodSeconds: 30
        timeoutSeconds: 10
        failureThreshold: 3
      readinessProbe:
        httpGet:
          path: /actuator/health
          port: 8080
        initialDelaySeconds: 30
        periodSeconds: 10
        timeoutSeconds: 5
        failureThreshold: 3
Docker Health Check
Add health checks to your Docker Compose:
services:
  solifi-consumer:
    image: limepoint/solifi-consumer:2.2.4
    healthcheck:
      test: ["CMD", "curl", "-f", "http://localhost:8080/actuator/health"]
      interval: 30s
      timeout: 10s
      retries: 3
      start_period: 60s
Alerting Recommendations
Set up alerts for:
| Condition | Threshold | Severity |
|---|---|---|
| Consumer lag | > 10,000 messages | Warning |
| Consumer lag | > 100,000 messages | Critical |
| Health check failed | 3 consecutive failures | Critical |
| Memory usage | > 80% | Warning |
| Memory usage | > 95% | Critical |
| Database connection failures | Any | Critical |
Next Steps
- Learn about error handling
- Understand data refresh
- Review the sizing guide